Conditional Formatting in Flex Tables
Highlight Key Data and Trends in your Word & PowerPoint Reports with Conditional Formatting
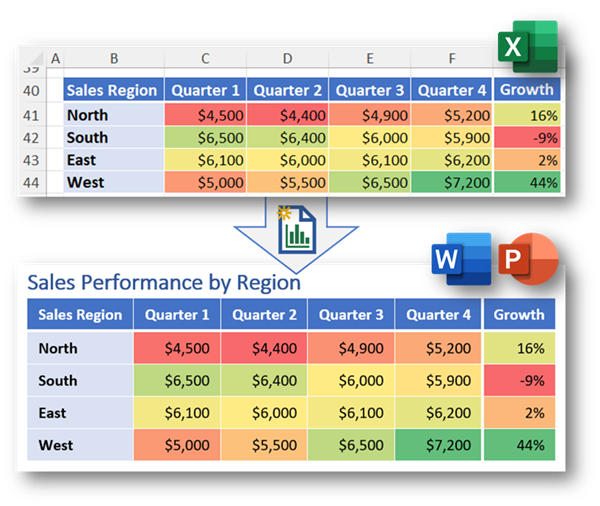
The Excel-to-Word Document Automation Add-in supports Conditional Formatting in Flex tables. This feature significantly enhances the power of Flex (source-formatted) tables in Word and PowerPoint reports.
Conditional Formatting is a powerful Excel feature that allows you to automatically apply formatting—such as colors—to cells based on the values they contain or specific rules you define. Your Word and PowerPoint reports can seamlessly and reliably update tables and graphics that include conditional formatting and table styles.

What Conditional Formatting Does
- Highlights important data: Make high or low values stand out with color.
- Visualizes trends: Use color scales to show patterns at a glance.
- Flags issues: Automatically mark duplicates, errors, or outliers.
How it can Improve Reporting
- Improves readability: Makes table data easier to scan and interpret.
- Saves time: Automates visual cues without manual formatting.
- Enhances decision-making: Quickly identifies key insights, like top performers or overdue tasks.
- Reduces errors: Flags inconsistencies or missing data for review.
Example Use Cases
- Finance & Accounting
- Monthly financial summaries: Highlight budget overruns, negative cash flow, or overdue invoices.
- Audit dashboards: Flag anomalies or compliance breaches.
- KPI scorecards: Visualize profitability, cost centers, or ROI metrics.
- Human Resources
- Workforce analytics: Highlight turnover, absenteeism, or engagement scores.
- Training compliance: Flag overdue modules or low completion rates.
- Policy compliance: Highlight missing reports or overdue actions.
- Retail & E-commerce
- Sales performance decks: Color-code top/bottom sellers or regional trends.
- Inventory aging reports: Flag slow-moving or overstocked items.
- Customer segmentation: Visualize loyalty tiers or churn risk.
- Manufacturing
- Production efficiency reports: Highlight downtime, throughput, or defect rates.
- Maintenance logs: Flag overdue service or high-failure equipment.
- Supply chain dashboards: Visualize lead times or bottlenecks.
- Logistics & Operations
- Delivery performance: Flag late shipments or route inefficiencies.
- Warehouse KPIs dashboards: Highlight pick/pack speed or error rates.
- Cost tracking reports: Visualize fuel usage or carrier spend.
How to Use Conditional Formatting in Flex Tables
- Ensure your item (range, table, or PivotTable) is a Flex table.
To format a table as a Flex (Excel-formatted) table: in the Excel add-in, on the ‘List’ tab, select ‘List/Manage Items’ > select the item (range or table) > for ‘Formatting Control’, select ‘Flex’. - Select your data in Excel. Go to Home > Conditional Formatting.
- Submit from Excel, then Update your Word or PowerPoint report using the Add-in.
Conditional formatting and applied styles work for Named Ranges, Tables, and PivotTables.
Supported formats: background color, font color, border color, bold, italics, and underline.
To Disable
This feature will be enabled by default, but users can disable the feature in the Excel add-in List tab > List/Manage Items > select the item > under Use Conditional Formatting & Styles, choose No.
Compatibility
- Requires Excel for Microsoft 365 (April 2025 or newer) or Excel for the web.
- Office on Windows Version 2504 or newer.
- Office on Mac Version 16.96 or newer.
- Conditional formatting, table styles, and PivotTable styles are ignored in earlier versions.
Learn more about Conditional Formatting from Microsoft.
Also see examples in the “Insert Sample Content” on the “Start” tab of the add-in.